| TOC > The interface > The visualization GUI | Previous | Next |
2.3.1.1 Pan & Zoom
2.3.1.2 Zoom
2.3.1.3 Information
2.3.1.4 Linked Pan & Zoom
2.3.1.5 Autozoom
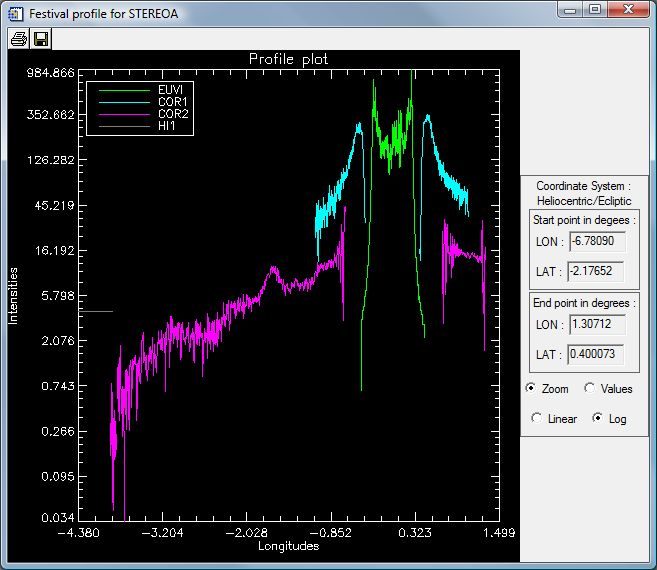
2.3.1.6 Profiles
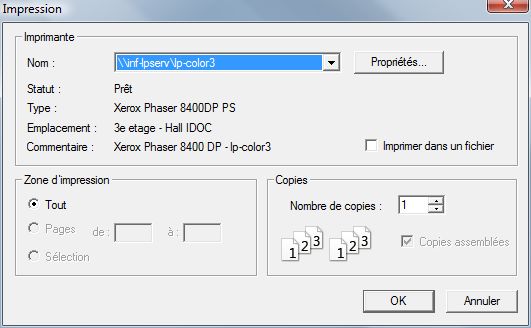
2.3.1.7 Print
2.3.1.8 Save image
2.3.1.9 Save sequence2.3.1.9.1 Time stamps
2.3.1.9.2 Pasting
2.3.1.9.3 Movie encoding
2.3.2.1.1 Window
2.3.2.1.2 Image
2.3.2.1.3 Data
2.3.2.1.4 Grids2.3.2.1.4.1 Sky coordinates grid
2.3.2.1.4.2 Carrington grid
2.3.2.1.4.3 Stonyhurst grid
2.3.2.1.4.4 Polar Grid2.3.2.1.5.1 Stars
2.3.2.1.5.2 Planets
2.3.2.1.5.3 NOAA active regions
2.3.3.1 Normal mode
2.3.3.2 Linked mode
2.3.3.3 Compact mode
2.3.3.4 Running difference mode
2.3.4 The data information table
In the visualization GUI, you manipulate the selected data.
![]()
This tool is activated by default. Click and drag to pan across the composite image. If your mouse has a wheel, you can also zoom in and out.
If your mouse does not have a wheel, you can zoom in and out with these two tools.
The autozoom button adjusts the zoom factor so that the whole composite image of the sky is visible. If your data are not visible in the visualization area, one possibility is that you are not looking at the right region of the sky. The autozoom button will put you back on track.
From this dialog you can print out the content of the visualization GUI.
You can save the content of a visualization GUI in the following image formats:
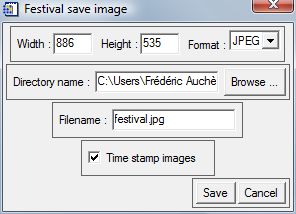
In postscript format, each image forming the composite is stored at its native resolution. As of today, the grid is rasterized also, even though it is a vectorial object within FESTIVAL. In the bitmap formats (JPEG, BMP, TIFF, PNG), the content of visualization GUI (including the coordinate grid if present) is rasterized before it is saved. By default, the scene is rasterized to produce an output of size equal to that of the visualization area of the GUI. But you can change the width and height in pixels of the output to produce an image of larger or smaller resolution. If you set the width, the height is computed to preserve the aspect ratio, and vice versa. The maximum resolution is 10000x10000 pixels.
Starting with version 4.0 of FESTIVAL, time stamps can be added to the saved images. See the time stamping section of the save sequence GUI for details on the time available options.
By default, a small FESTIVAL logo is added at the bottom left of the images, and a small SECCHI logo is added at the bottom right if SECCHI data are being visualized. These can be turned off by unchecking the corresponding boxes in the system GUI.
FESTIVAL is able to save at once a whole sequence of images that can later be put together in a movie (i.e. mpeg or animated gif) using a video encoding software. The available image formats are the same as for individual images. By default, the start and end dates of the sequence are the dates of the first and of the last images of the list displayed in the selection GUI. You can change them to save only part of the sequence.
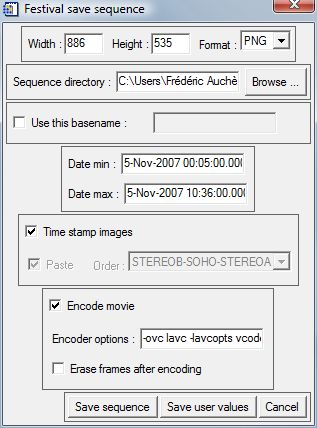
The sequence of images saved is equivalent to what you would get by clicking the next button through the list of images. The current mode (normal, compact, linked) is taken into account as if you were clicking the next image button. FESTIVAL warns you if you try to save a sequence while not in compact mode. The reason is that if you are not in compact mode, the data that form the composite will generally not be synchronized anymore after a few time steps.
Starting with version 4.0 of FESTIVAL, the images can be time stamped. By default, FESTIVAL adds a black background banner on top of the saved images, with the date and time for each image in the view written in white. The behavior of this option is controlled by the following environment variables:
Environment variable |
Values | Effect |
!TIME_STAMP_ADD_BANNER |
!TRUE |
Writes the times either in an added banner (the default) or directly on top of the image |
!TIME_STAMP_POSITION |
!TIME_STAMP_TOP_LEFT |
Defines the position to the time stamp. The default is top left. |
!TIME_STAMP_ALL_DATES |
!TRUE !FALSE |
Defines wether all the times of all the images of the view are written (the default), or only one. If set to !FALSE, then in compact mode only the compact date is written, and in normal mode only the date of the innermost instrument is written. |
!TIME_STAMP_COLOR |
Byte array of [R, G, B] weights | The Red, Green and Blue weights (0-255) of color of the font to be used. |
!TIME_STAMP_BACKGROUND_COLOR |
Byte array of [R, G, B] weights | The Red, Green and Blue weights (0-255) of the background color. |
!TIME_STAMP_BACKGROUND_IS_TRANSPARENT |
!TRUE !FALSE |
If !TIME_STAMP_ADD_BANNER is set to !FALSE, this defines wether a uniform background color should be drawn or not. Setting it to !FALSE masks part of the image but produces more readable results stamps. |
!TIME_STAMP_SIZE |
Floating point value | The size of the font to be used. Default is 1.2. |
!TIME_STAMP_THICKNESS |
Floating point value | The thickness of the font to be used. Default is 3.0. |
For example, to add red time stamps on top of the images in the bottom right corner, use the following IDL commands:
IDL> !TIME_STAMP_COLOR = [255, 0, 0]
IDL> !TIME_STAMP_POSITION = !TIME_STAMP_BOTTOM_RIGHT
IDL> !TIME_STAMP_BACKGROUND_IS_TRANSPARENT = !TRUE
IDL> !TIME_STAMP_ADD_BANNER = !FALSE
These options are used to paste images from different probes side by side. They are available only if your are visalizing data from at least two probes, i.e. if at least two visualization GUIs are opened. If the Paste box is checked, the images from the different views will be pasted in the order defined in the droplist on the left. The default is STEREO B on the left, SOHO in the middle and STEREO A on the right.
If the Encode movie box is checked, FESTIVAL will spawn a command to run mencoder to encode the sequence of images into an avi movie. The encoding options can be modified in the text field below. Mencoder must be installed on your computer and the installation directory must be added to your local path. To make sure that FESTIVAL will be able to run mencoder, type in mencoder at a command prompt (under LInux or Windows). If mencoder does not start, make sure your path is set properly.
If you do not want to keep the individual frames, check the Erase frames after encoding box.
For advanced encoding, it is recommended to manually encode the frames. Under Linux or Windows, mencoder/mplayer is a powerful encoder/decoder package. For example, you can create an AVI movie from a sequence of images saved in JPG format with this command:
mencoder "mf://*.jpg" -o mymovie.avi -ovc lavc -lavcopts vcodec=msmpeg4v2:vbitrate=3600
Many other options (formats, codecs, etc.) are available.
Under Windows, another option is Windows Movie Maker. This is an easy way to make movies, even if the encoding options are limited. Photoshop is a possibility if you want to create an animated GIF. Tip: To avoid the flicker from frame to frame, turn off the autoscale in the visualization enhancement GUI and set the limits to values that work well for the whole sequence.
By default, a small FESTIVAL logo is added at the bottom left of the images, and a small SECCHI logo is added at the bottom right if SECCHI data are being visualized. These can be turned off by unchecking the corresponding boxes in the system GUI.
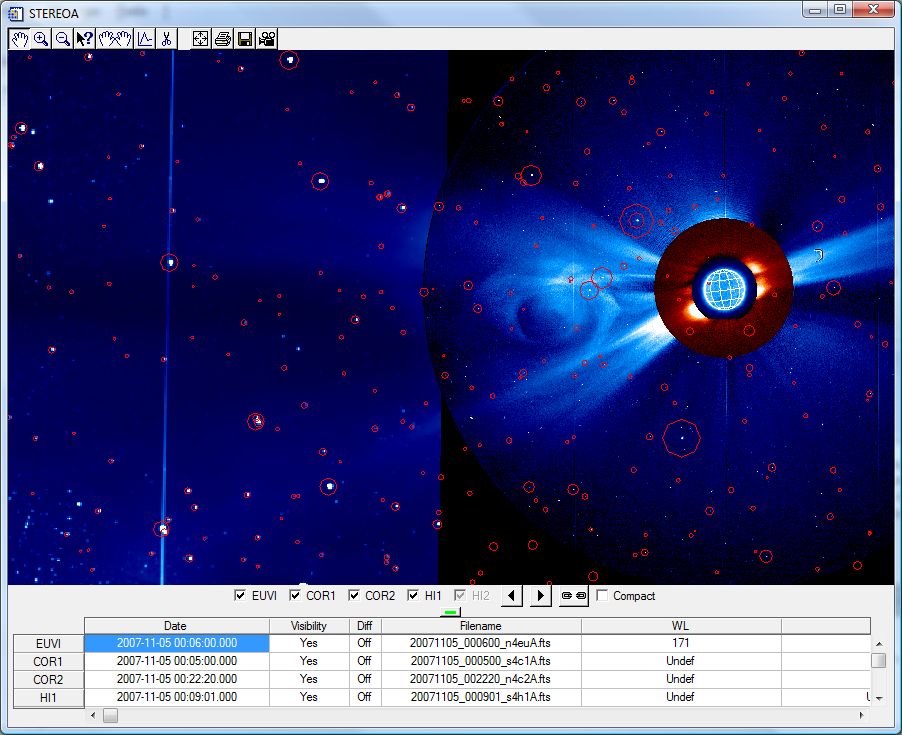
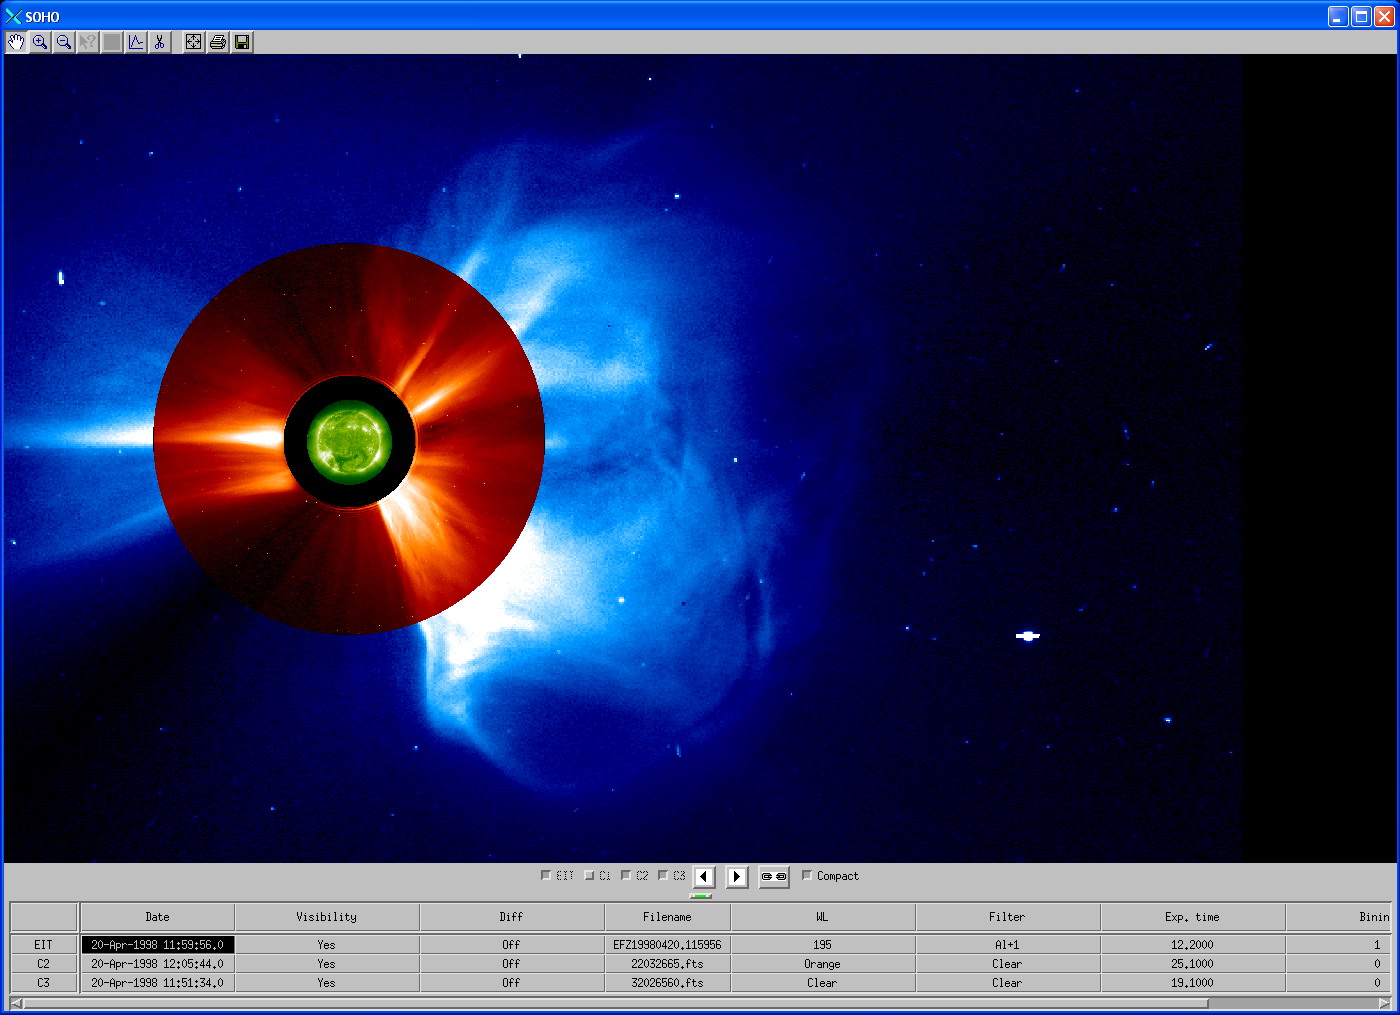
The visualization area is the central part of the visualization GUI. This is where the composite image is displayed.
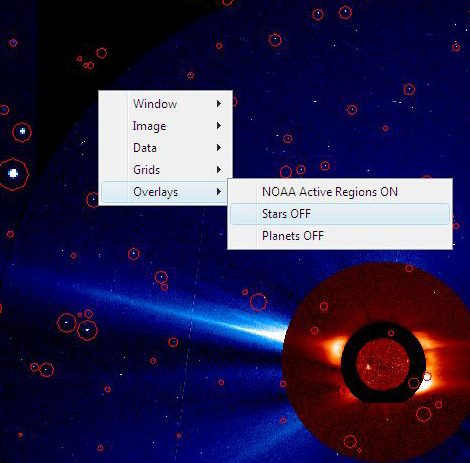
The contextual menus are accessible by right-clicking in the draw area of the visualization GUIs.
Each menu is described in the following paragraphs.
From the window menu, it is possible to control the exact size of the visualization GUI. Use Window->Set same size as to give the view the same size as another opened GUI. Use Window-> Set size to give the view a precise size in pixels. There are three predefined settings (512x512, 640x480 and 1024x768), and a custom size option. These resizing options are very useful to make side by side movies from two or three probes, or for stereo vision applications. See also the linked pan & zoom mode.
The data contextual menu gives you access to the headers of the currently visualized images.
2.3.2.1.4.1 Sky coordinates grid
When a visualization GUI is opened, turning on and off the grid is faster from the contextual menu than from the projection coordinates GUI. The two methods are strictly equivalent.
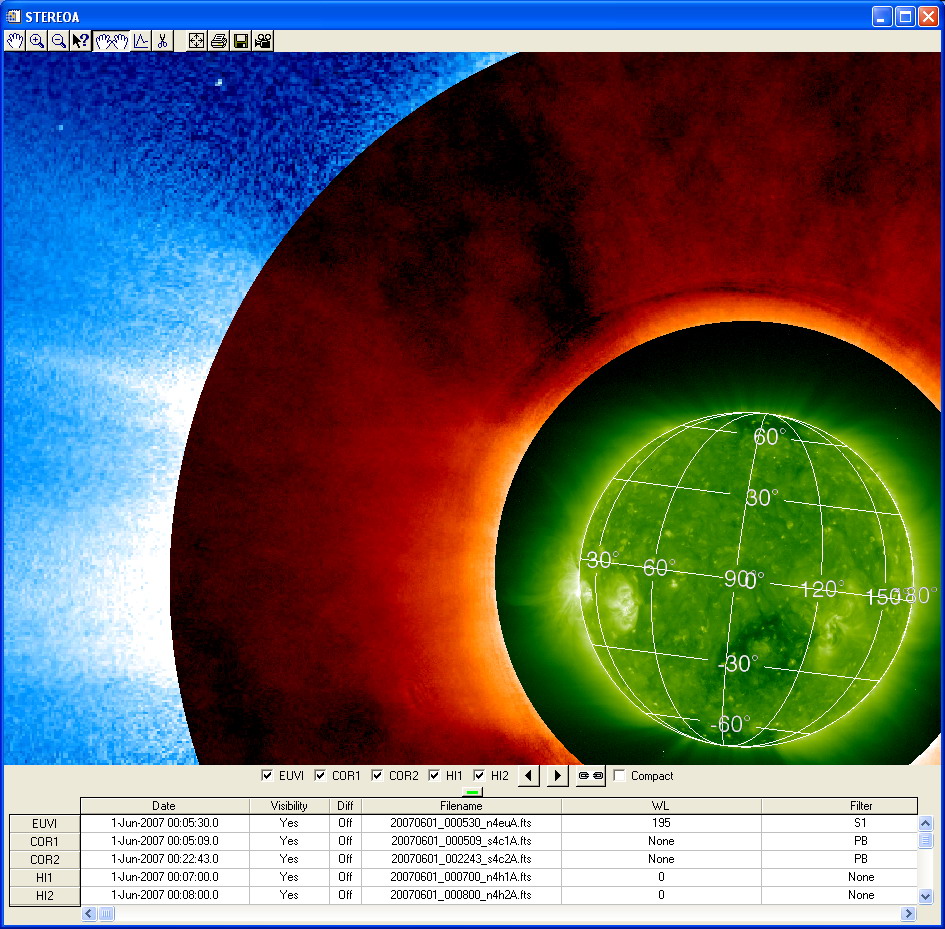
This toggle activates a Carrington grid in the current visualization GUI. In the case when multiple data are visualized in the visualization GUI, the Carrington grid is computed for the date of the innermost instrument. For example, if EUVI, COR1 and COR2 data are visualized, the grid corresponds to the date of the EUVI data. The grid is recomputed whenever the date of the innermost data changes. Go o the animations page to see the result in two movies.
 |
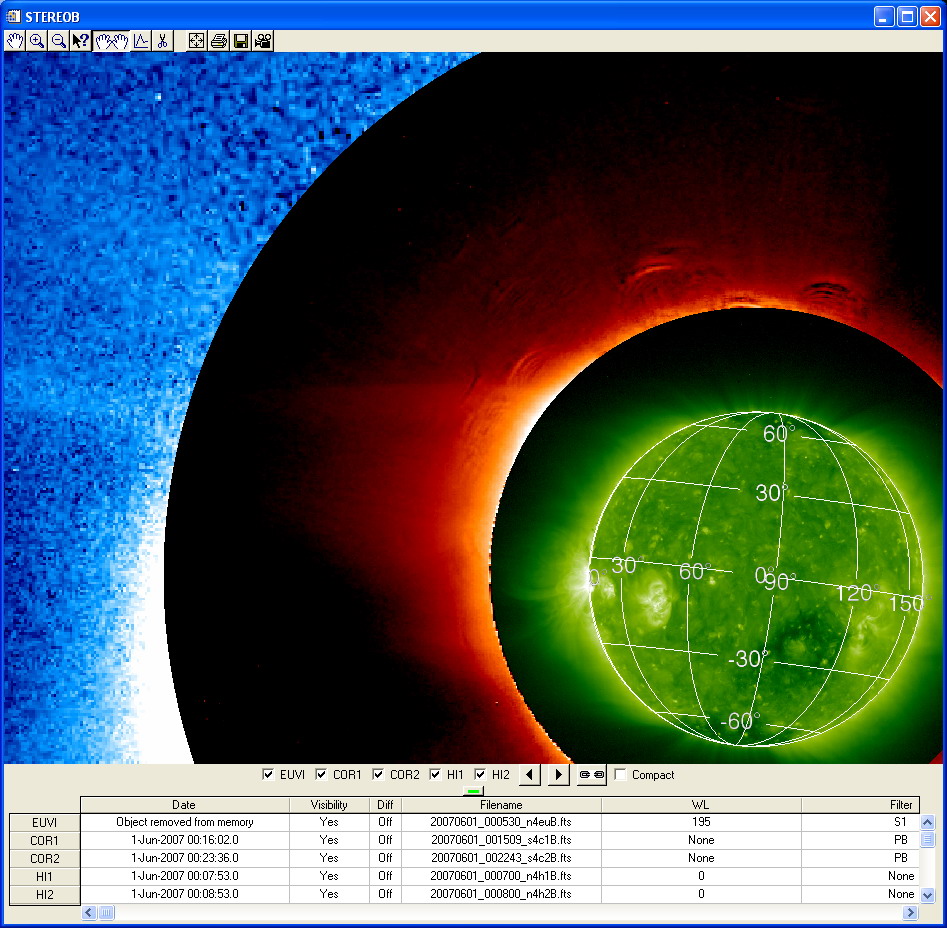 |
| Simultaneous STEREO A & B data with Carrington grids overlayed. The Carrington longitudes and latitudes of STEREO A & B are clearly different. | |
The Carrington grid properties (color, grid step, label size...) can be customized by changing the default values in the Options->Grids... GUI.
This toggle activates a Stonyhurst grid in the current visualization GUI. In the case when multiple data are visualized in the visualization GUI, the Stonyhurst grid is computed for the date of the innermost instrument. For example, if EUVI, COR1 and COR2 data are visualized, the grid corresponds to the date of the EUVI data.
The Stonyhurst grid properties (color, grid step, label size...) can be customized by changing the default values in the Options->Grids... GUI.
This toggle activates a polar grid in the current visualization GUI. In the case when multiple data are visualized in the visualization GUI, the polar grid is computed for the date of the innermost instrument. For example, if EUVI, COR1 and COR2 data are visualized, the grid corresponds to the date of the EUVI data.
The polar grid properties (color, grid step, label size...) can be customized by changing the default values in the Options->Grids... GUI.
FESTIVAL is able to display the HIPPARCOS stars on top of the images. Simply select the Overlays6> Stars ON option. The stars are cirled in red. The stars color, thickness and radius can be adjusted in the overlays GUI. The color and size of the stars can be modified using the overlays GUI.
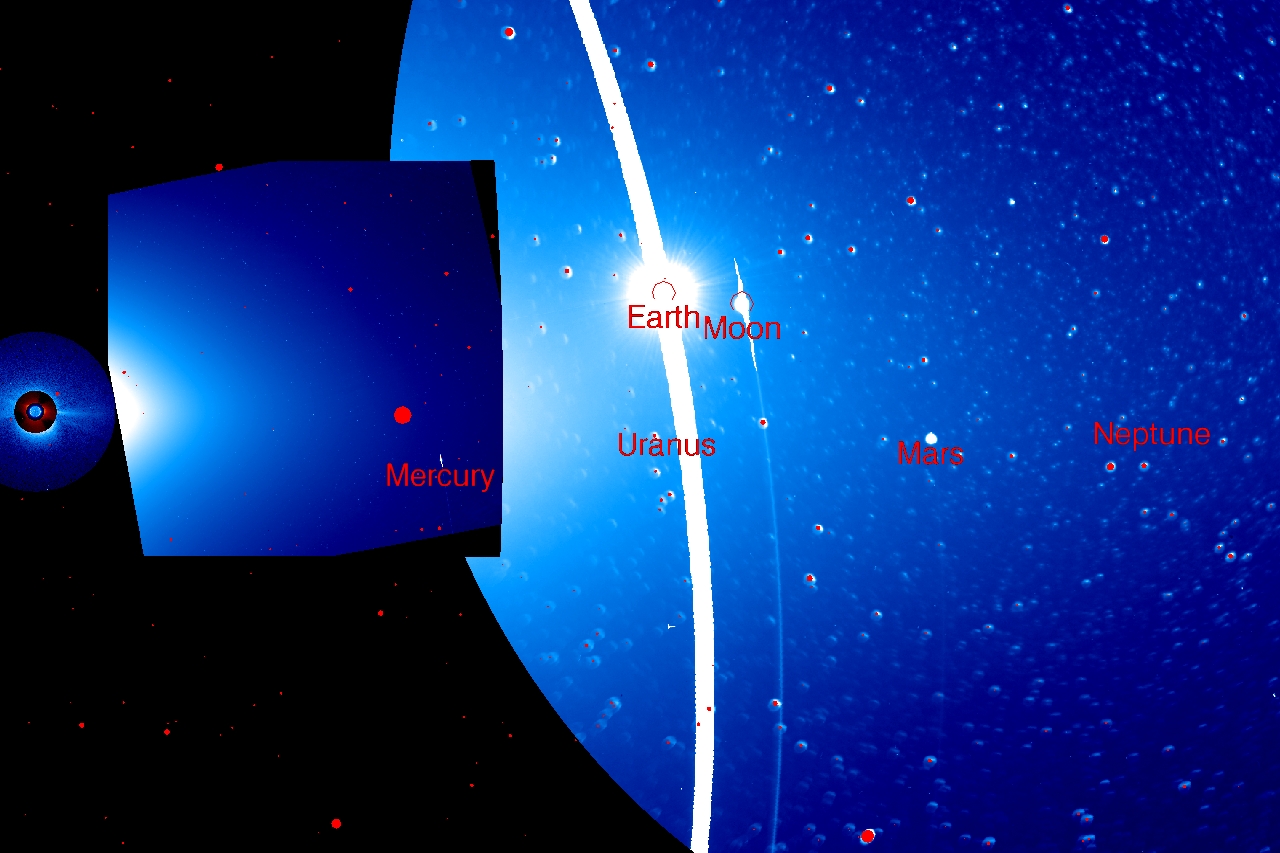
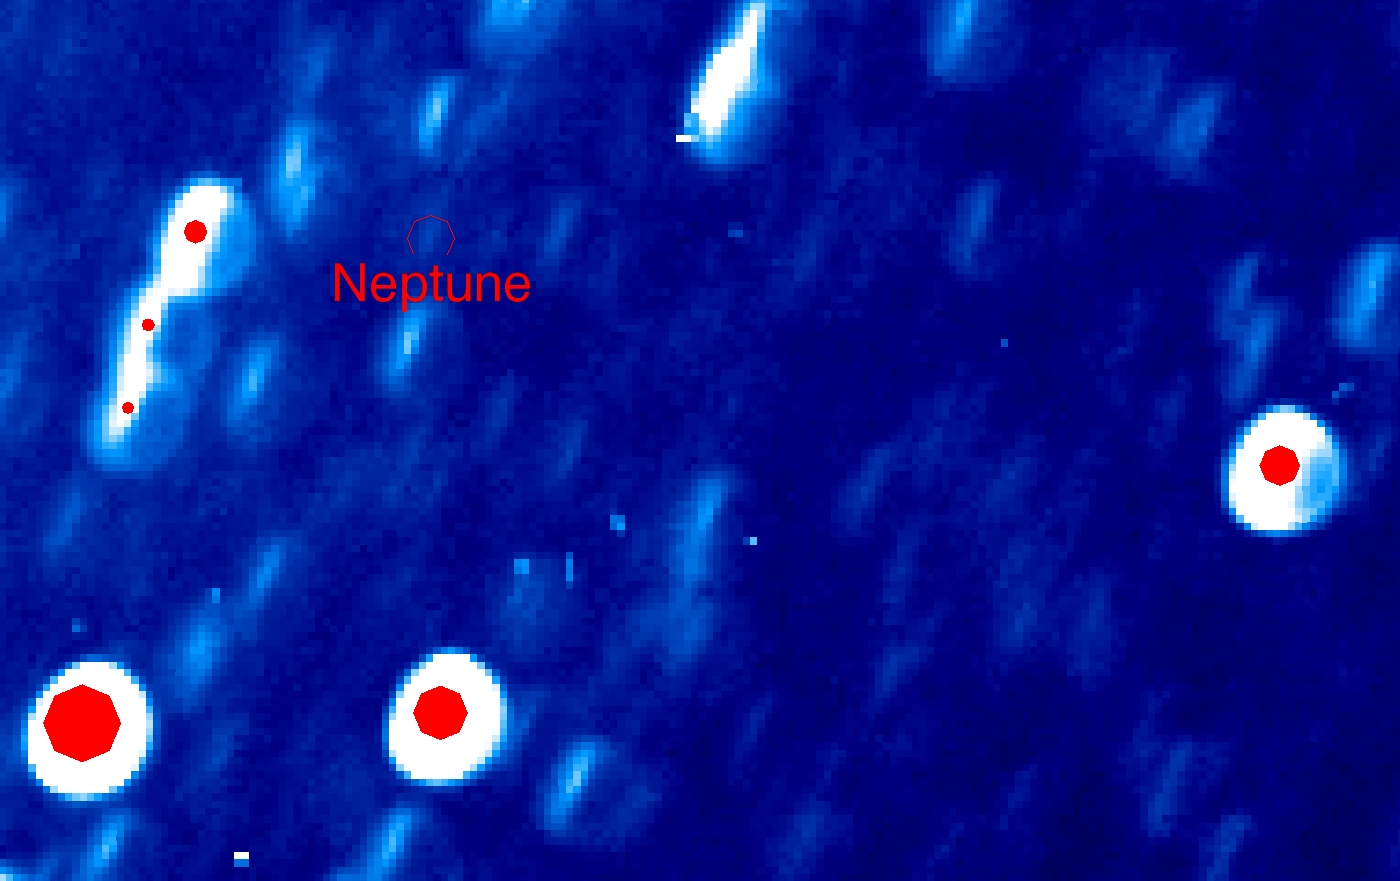
FESTIVAL can overlay the nine planets (we still have Pluto as a planet ...), the Moon, the four Gallilean satellites of Jupiter and Titan. For the ephemeris of the planets, FESTIVAL uses a webservice provided by the Institut de Mécanique Céleste et de Calcul des Ephémérides (IMCCE). This implies that the planets can be drawn only if you have an internet connection. The color, size and thickness of the planets ans labels can be modified using the overlays GUI.
2.3.2.1.5.3 NOAA active regions
NOAA active regions numbers can be overlayed on the images. This functionality uses the SSW GET_NAR funtion to get the active regions coordinates. By default, the active regions are labeled and circled in red. The color, size and thickness of the active regions and labels can be modified using the overlays GUI.
The navigation bar is located just below the draw area and groups together all the time navigation controls. It comprises checkboxes to select the instruments, a previous image and a next image button, the linked mode toggle and the compact mode toggle. The behavior of the next and back buttons depends upon the selected navigation mode.
![]()
In normal mode (as opposed to the compact mode), clicking on the next or back buttons brings up the next or previous image for each of the selected instruments. A click on an entry of the selection GUI table brings up only that data.
In linked mode, the back and next buttons apply to all the opened GUIs, whether you are in normal or compact mode. Click the ![]() button to activate it.
button to activate it.
n compact mode, FESTIVAL always keeps all the visualized data as close in time as possible from each other. A click on any entry of the selection GUI table will not only bring up the selected data (as it would be the case in normal mode), but also the images from the other selected instruments that are closest in time to it. Depending on what is present in the history stack, this may result in the computation of more than one image. A click on the back or next buttons of thenavigation bar (or hitting the left or right keyboard arrows) will synhronize the view on the previous or on the next image of any one of the instruments selected in the navigation bar.
If the linked mode is also activated, the compact mode extends to all the probes. This means that all the data from the selected instruments/probes are kept as close in time as possible.
![]() FESTIVAL is not able to work in running difference mode with images of different sizes. It will not crash but will produce unreliable results. There are two workarounds for this:
FESTIVAL is not able to work in running difference mode with images of different sizes. It will not crash but will produce unreliable results. There are two workarounds for this:
The data information table located at the bottom of the visualization GUI displays the details of each of the images that constitute the composite currently displayed in the visualization GUI. This table can be hidden by clicking on the ![]() button. Click that button again to expand the table. The information shown for each data are the same as those present in the results table of the selection GUI. The two Visibility and Diff extra columns are clickable.
button. Click that button again to expand the table. The information shown for each data are the same as those present in the results table of the selection GUI. The two Visibility and Diff extra columns are clickable.
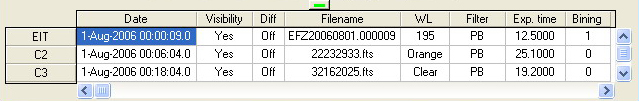
By clicking in the visibility column, you can quickly hide or show the image of each instrument. This does not mean that the data is removed from memory, so the information related to that data is still shown in the table. With this option, it is easy, for example, to look at the overlapping region between LASCO C2 and C3 in both instruments.
The Diff column lets you switch to running difference mode for each instrument independently. In this mode, the data previous to the visualized one is computed (or pulled from the history stack) and the difference is displayed. The back and next buttons work as usual. If you try to switch to difference mode while the visualized data is the first on the list, the difference can not be computed and no image is displayed.