|
| Home | CIB and EBL | Galaxies | Model | Simulations | Downloads | Publications |
| | |||||||||
| Infrared Galaxies | |||||||||
Recent results on infrared galaxies
|
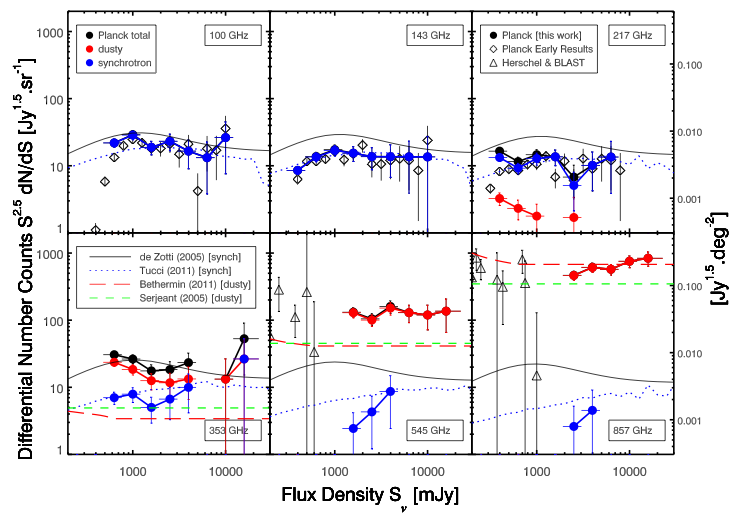
Planck submm and mm number counts of IR and radiogalaxies 2013
|
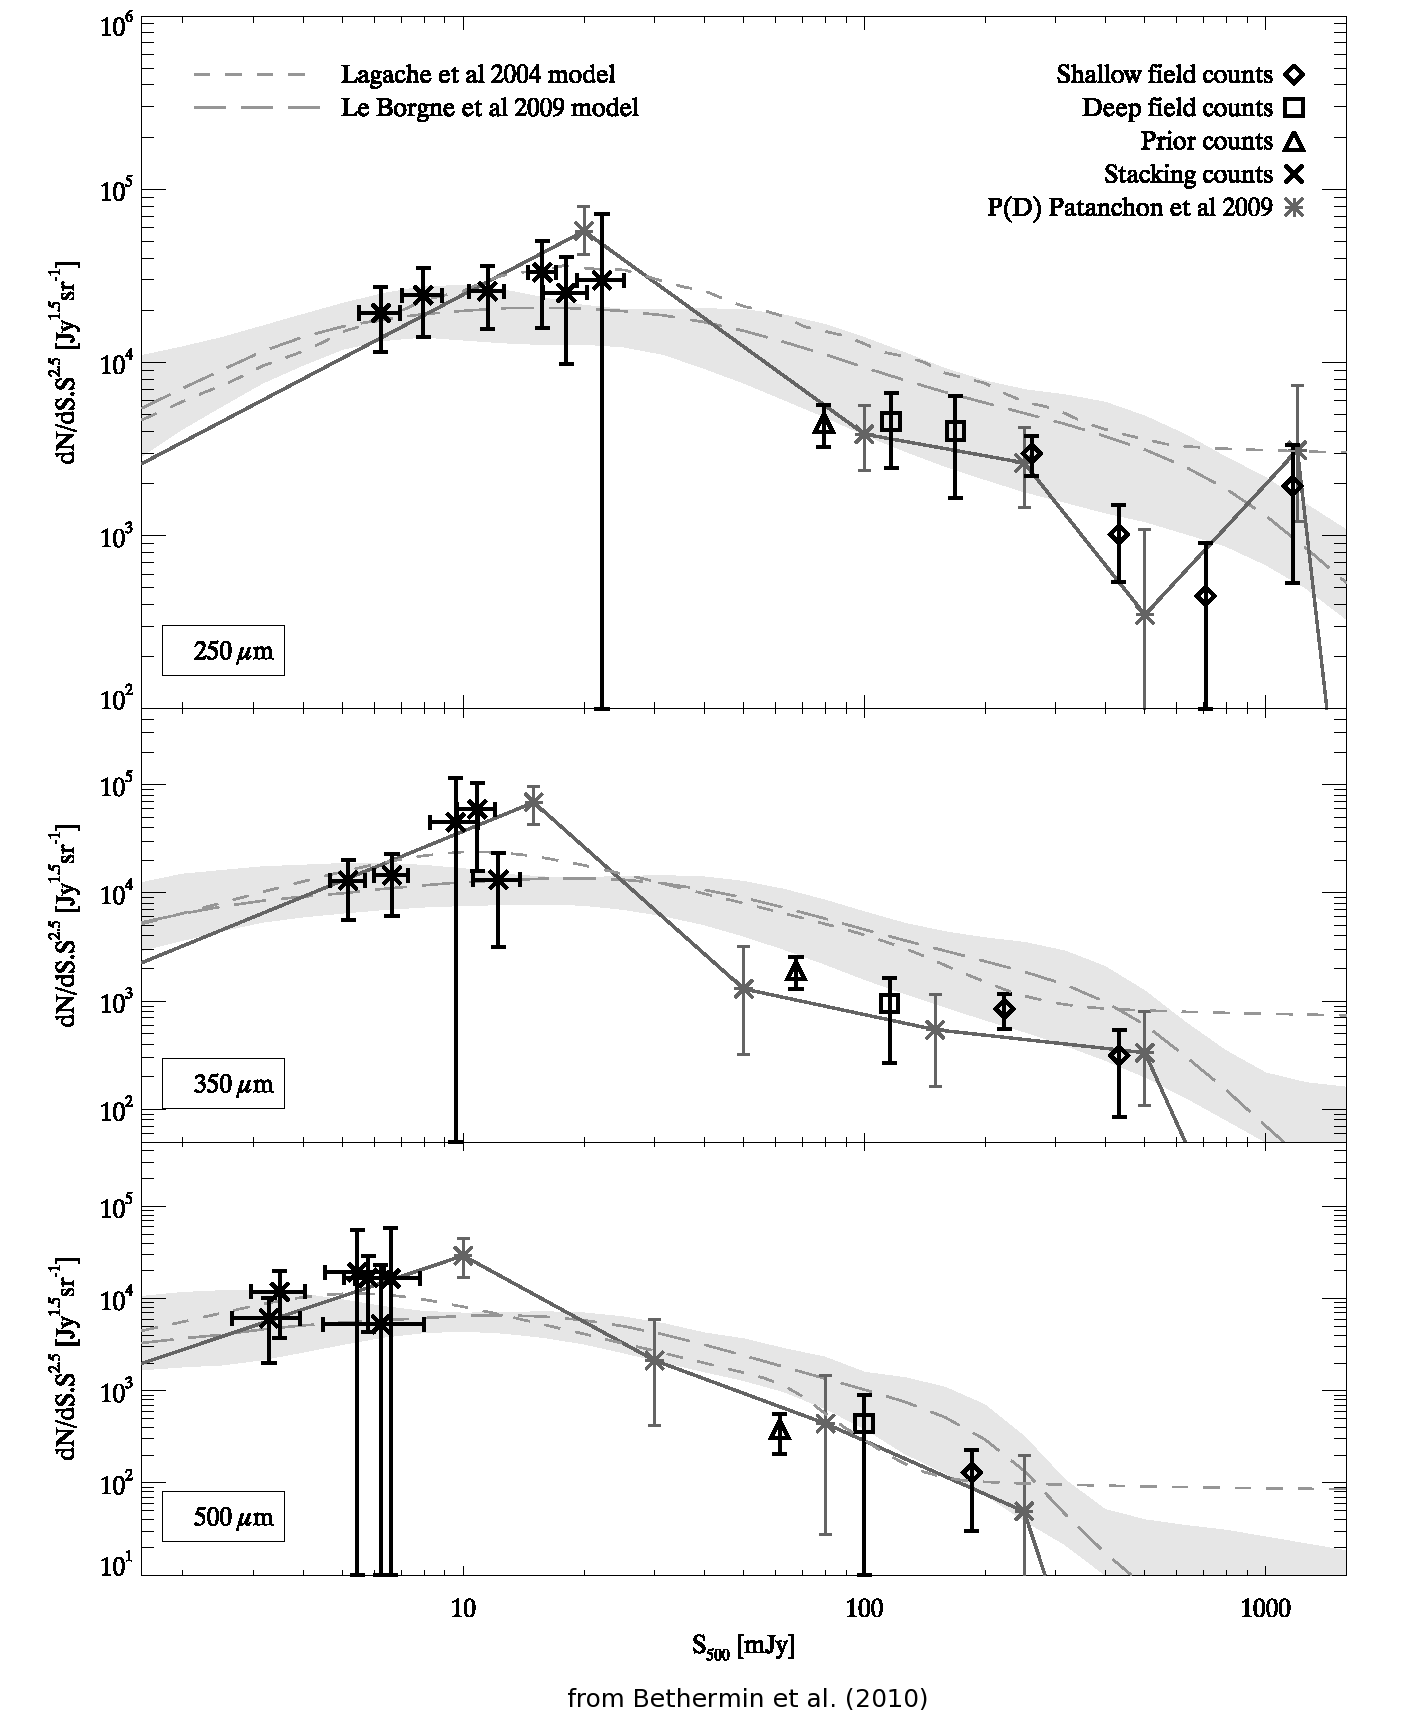
BLAST sub-mm number counts 2010
BLAST observed the CDFS at 250, 350 and 500 microns. The BLAST team
published first counts made with a P(D) analysis (Patanchon et
al. 2009, ApJ 707,1750). We performed a complementary analysis to test
the agreement between the P(D) analysis and the method used for the
MIPS number counts. There is a good agreement between the two
methods. Our methods provides a better sampling in flux and smaller
error bars than P(D) analysis for brigth source counts.
|
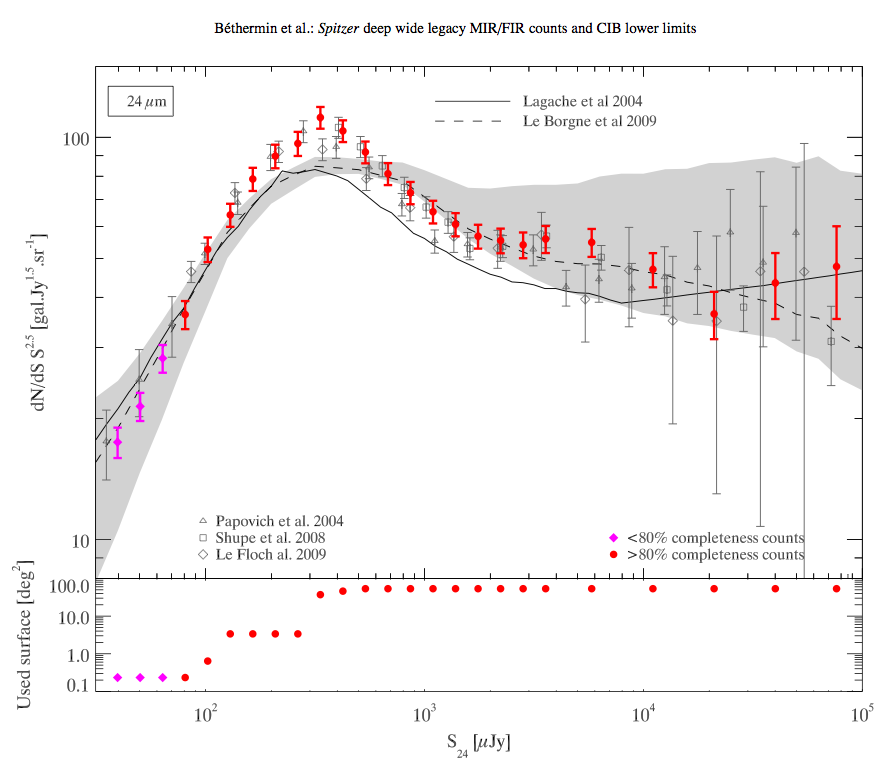
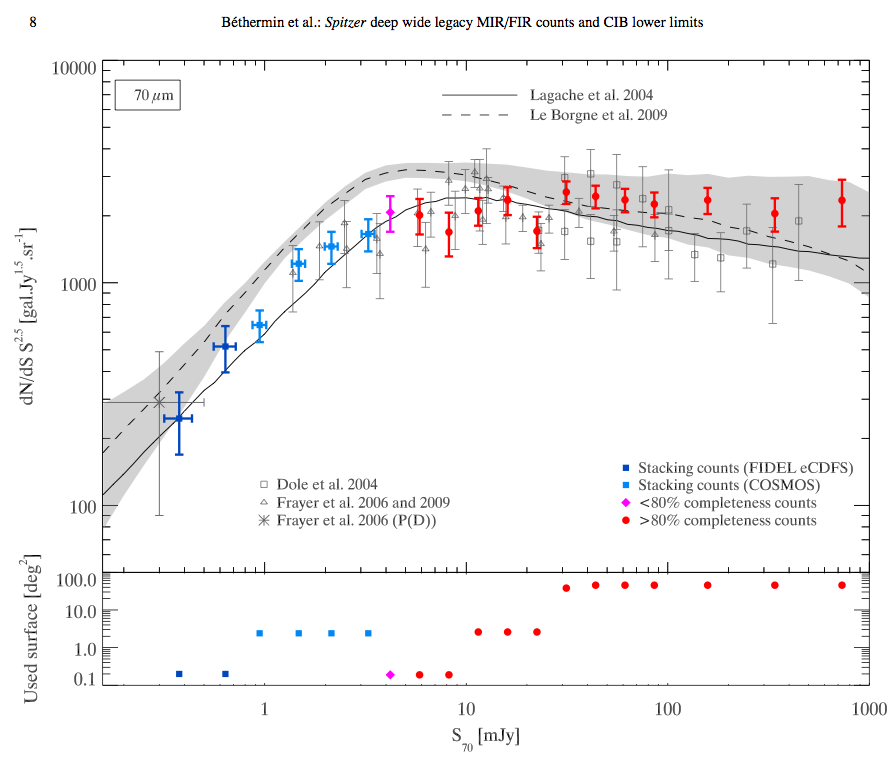
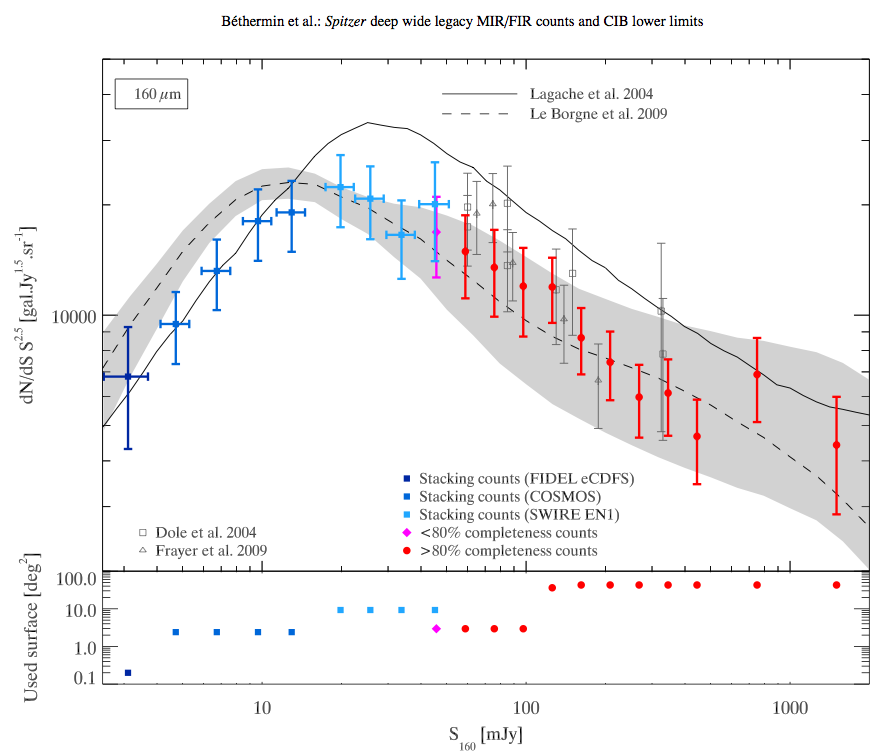
2010 Spitzer Deep and Wide Legacy Mid- and Far-Infrared Number Counts
For each MIPS wavelength (24, 70 and 160 microns), we have performed
an homogeneous source extraction on FIDEL, COSMOS and SWIRE fields. We
have used Monte-Carlo simulations to correct extraction biases. We
finally obtain high-statistics number counts for several decade of
flux.
|
Spitzer Source counts at 24, 70 and 160 microns in 2004Check the Spitzer 2004 source counts web page. |
Properties of the galaxies making the 24 micron background
The advent of the Spitzer Space telescope allowed us to study the IR galaxy population up to
high redshifts for the first time. Using a very deep sample of Ks-band-selected galaxies
(Ks<21.5; Vega mag), we achieved ~94% of identification of all the 24 micron galaxies with
S(24 micron) > 83 microJy in the GOODS/CDFS (Caputi et al. 2006, ApJ, 637, 727).
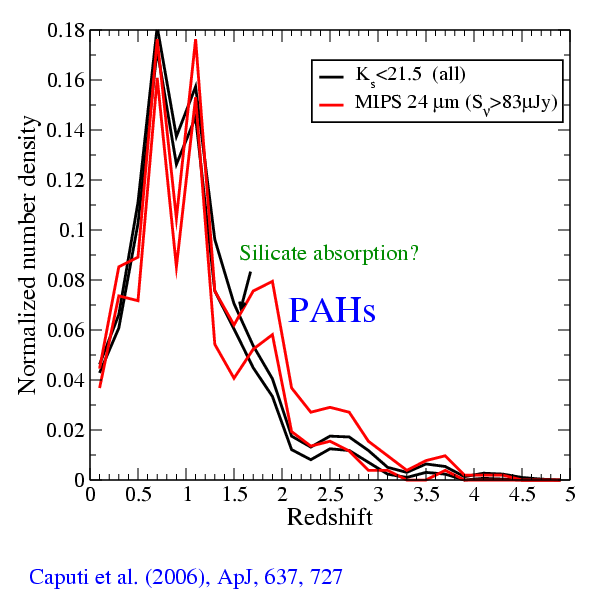
Caption: 95% confidence limits on the normalized redshift distributions of 24 micron galaxies (red line) and all the Ks<21.5 (Vega mag) galaxies (black line) in the GOODS/CDFS. This figure shows that ~72% of 24 micron galaxies are present a redshifts z<1.5, while the remaining ~28% lie at higher redshifts. From the comparison of the normalized redshift distributions of 24 micron galaxies and all the parent sample of Ks<21.5 mag galaxies, we determined that both populations basically follow the same large-scale-structure pattern. However, the 24 micron galaxy redshift distribution has an additional significant bump around z~1.9, which is not present for the total Ks-band galaxy population. We interpreted this bump as the positive selection effect produced by 7.7 and 8.6 micron PAH emission lines entering the 24 micron passband at that redshift. This result strongly suggests that an important fraction of the S(24 micron) > 83 microJy population at z~1.9 is composed of star-forming galaxies which already characterised by PAH emission. |
Constraints on star formation history
Using the 24 micron fluxes, one can obtain an estimate of the star formation rates (SFR) of star-forming
galaxies. On the other hand, through the analysis of the rest-frame optical/near-IR SED of each galaxy,
one can derive an estimate of its already assembled stellar mass. The study of both properties in
conjunction allows to determine at what rates stars form in galaxies with different stellar masses at
different cosmic times.
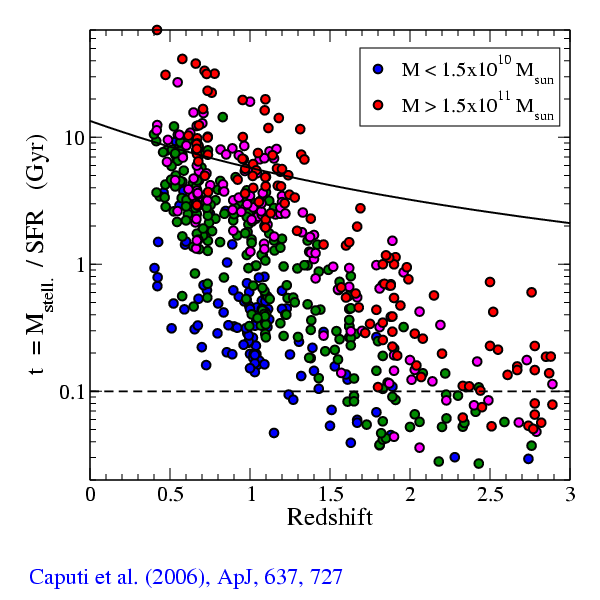
Caption: The ratio between the already assembled stellar mass and the instantaneous SFR for the S(24 micron) > 83 microJy galaxies in the GOODS/CDFS, versus redshift. Different colours represent galaxies with different assembled stellar masses (with the less massive galaxies in blue and the most massive galaxies in red). The solid line shows the age of the Universe as a function of redshift and the dashed line delimits the typical maximum lifetime of a burst of star formation. Several interesting conclusions can be extracted from the analysis of this figure. Firstly, at redshifts z<1.5, we see that the most massive galaxies have in general the largest M/SFR ratios (i.e. the lowest specific star-formation rates SFR/M). The fact that for some galaxies M/SFR is larger than the age of the Universe at the same redshift simply means that these galaxies must have had larger SFR in the past. At higher redshifts z~2.0-3.0, most of the M/SFR values are only a few times the lifetime of a single burst of star formation (which typically lasts less than 0.1 Gyr). This indicates that the burst-like mode of star formation was probably a very efficient way of constructing entire galaxies in the past. Remarkably, most of these bright 24 micron galaxies at high redshifts are already quite massive galaxies, with M> 10^11 Msun. At lower redshifts, in contrast, the burst-like mode of star formation appears to be efficient only in less massive systems. Although the burst-like mode might be present in massive galaxies at redshifts z<1.5-2.0, each episode of star formation would only add a minor amount to the already assembled stellar mass. |
The role of IR galaxies in the evolution of the most massive galaxies
Another topic we have been working on is the determination of the role of IR galaxies among all the Ks-band
selected galaxies. In particular, we have studied luminous and ultra-luminous IR galaxies (LIRGs and ULIRGs,
respectively) within the context of the total Ks-band galaxy population
(Caputi et al. 2006, A&A, 454, 143).
We determined that a significant fraction of all the most massive galaxies are experiencing a LIRG or ULIRG
phase, and this fraction is larger at higher redshifts.
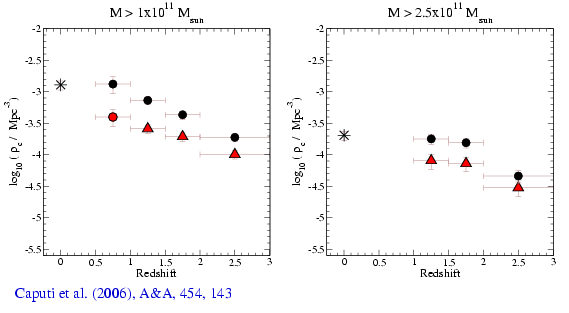
Caption: The comoving number densities of all the most massive galaxies present at different redshifts (black circles; cf. Caputi et al. 2006, MNRAS, 366, 609) and the corresponding densities of galaxies which are LIRGs or ULIRGs (red symbols, with upward-pointing triangles for lower limits). | ||
|
- http://www.ias.u-psud.fr/irgalaxies - Groupe Matière Interstellaire et Cosmologie Institut d'Astrophysique Spatiale (IAS), bat 121, F-91405 Orsay Cedex, France. Université Paris Sud 11 and CNRS (UMR 8617) |
|||||||||