Results of the stacking analysis on the cosmic infrared background by Dole et al (2006).
The
Cosmic Infrared Background Resolved by Spitzer
Press Release - Embargoed Until Apr 20th, 2006, 15hUT
Dr Hervé Dole
Institut d'Astrophysique Spatiale
Université Paris-Sud 11 and CNRS, Orsay, France
email: Herve.Dole[at]ias.u-psud.fr
tel: 0 11 33 1 69 85 85 72
cell: 0 11 33 626 79 25 44
fax: 0 11 33 1 69 85 86 75
Last modified: Fri Apr 21 10:21:08 CEST 2006
[mirror site in Orsay, France]
[mirror site in Tucson, AZ]
[Press Release in English]
[Communiqué de Presse en Francais]
Link to the Spitzer Science Center news feature:
- http://www.spitzer.caltech.edu/Media/happenings/20060420 [starting Apr 20th, 2006]
Link to the CNRS Press Release (in french):
- http://www2.cnrs.fr/presse/communique/853.htm [starting Apr 20th, 2006]
- http://www.insu.cnrs.fr/web/article/art.php?art=1747 [starting Apr 20th, 2006]
Text of the news feature: [PDF] [Web Page]
Download the actual scientific paper: Dole et al., 2006, Astronomy
and Astrophysics:
- PDF on Astronomy and Astrophysics site
- PDF on preprint site
Illustrations of the Press Release:
Download mpg Animation:
[mpg (4Mb)]
[mpg (7Mb) using
reverse colors]
This animation shows images at 24 microns (left), 70 microns (middle)
and 160 microns (right) of the sky. Each frame in this animation is
the result of the stacking of many galaxies (number written in the top
right corner). You can see how at 70 and 160 microns the signal of
faint galaxies (right in the center) becomes stronger and stronger
(scientists say that the signal-to-noise ratio increases).
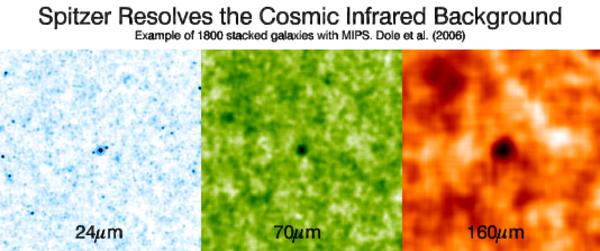
Image 1:
Results
of the stacking analysis on the cosmic infrared background by Dole et
al (2006).
Stacking ~1800 faint galaxies seen at 24um (left, blue) allows Dole and his team to securely detect "invisible" galaxies at 70um (middle, green) and 160um (right, red) which are not detected individually. This strong signal (center of the two right panels) is the signature of galaxies accounting for most of the cosmic infrared background.
Credit: H. Dole/IAS/Arizona/NASA/JPL-Caltech
Download this Image at High Resolution:
[Original in PS] [tiff]
Image 2:
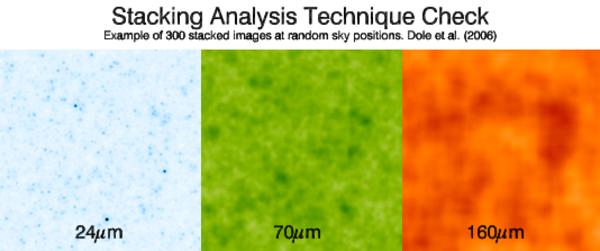
Stacking
the sky and random positions gives no signal in the center, as
expected. This method is used to check the robustness of the stacking
analysis technique. The color scale is the same as the previous
figure.
Credit: H. Dole/IAS/Arizona/NASA/JPL-Caltech
Download this Image at High Resolution:
[Original in PS] [tiff]
Image 3:
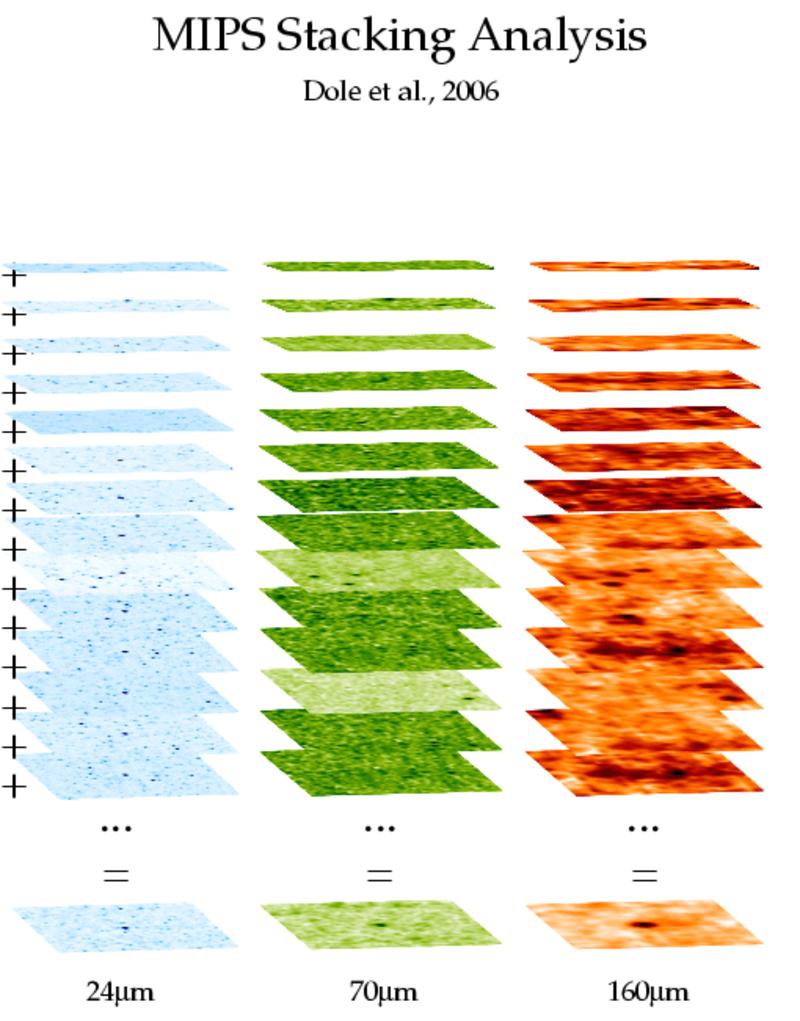
Illustration of the stacking technique used by Dole and his team.
They first select galaxies at 24 microns (left column). Then, they select the same sky areas at 70 and 160 microns (center and right column), where no galaxy is visible. When they stack all the images (bottom line), they detect the signal of all the unresolved galaxies. You can also see the mpg animation.
Credit: H. Dole/IAS/Arizona/NASA/JPL-Caltech
Download this Image at High Resolution:
[Original in PS (HUGE: 62Mb)] [tiff]
Plot 1:
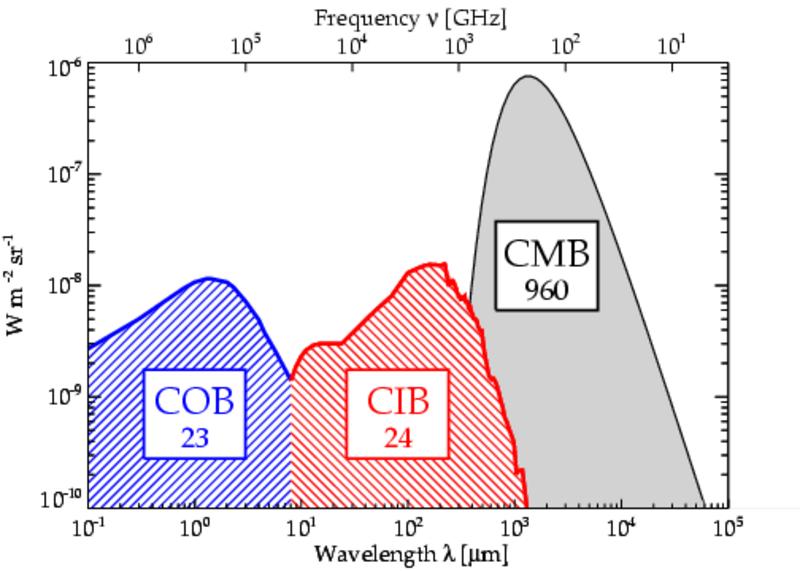
The
main background radiations in the Universe.
From right to left (increasing frequency): the Cosmic Microwave Background (CMB), or 3K blackbody radiation. The Cosmic Infrared Background (CIB), and the Cosmic Optical Background (COB). The CMB has its origin very early in the Universe's history, and the CIB and COB (also called Extragalactic Background Light, or EBL) are due to the light emitted by all the galaxies. These backgrounds fill-up the entire Universe. The numbers written correspond to the brightness of each background. Notice that the EBL represent only about 5% of the brightness of the CMB. Finally, the EBL has about 115 infrared photons for 1 visible photon.
Credit: H. Dole et al./IAS
Download this Plot at High Resolution:
[Original in PS] [tiff]