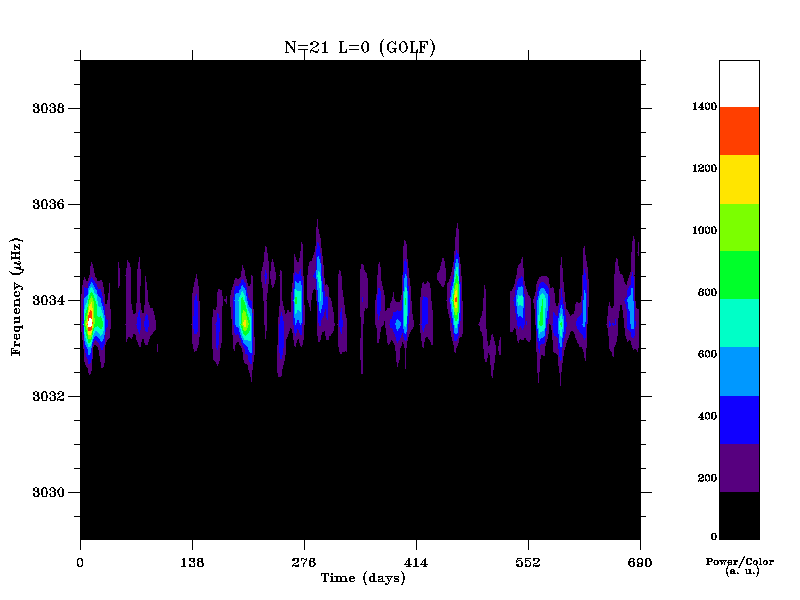
Results and Gallery - A time/frequency diagram
-
A time/frequency diagram of the (n=21,l=0) mode (note the high signal to noise ratio - see scale on the left - the "impulsive" temporal behaviour and the apparent frequency variations due to stochastic excitation):
