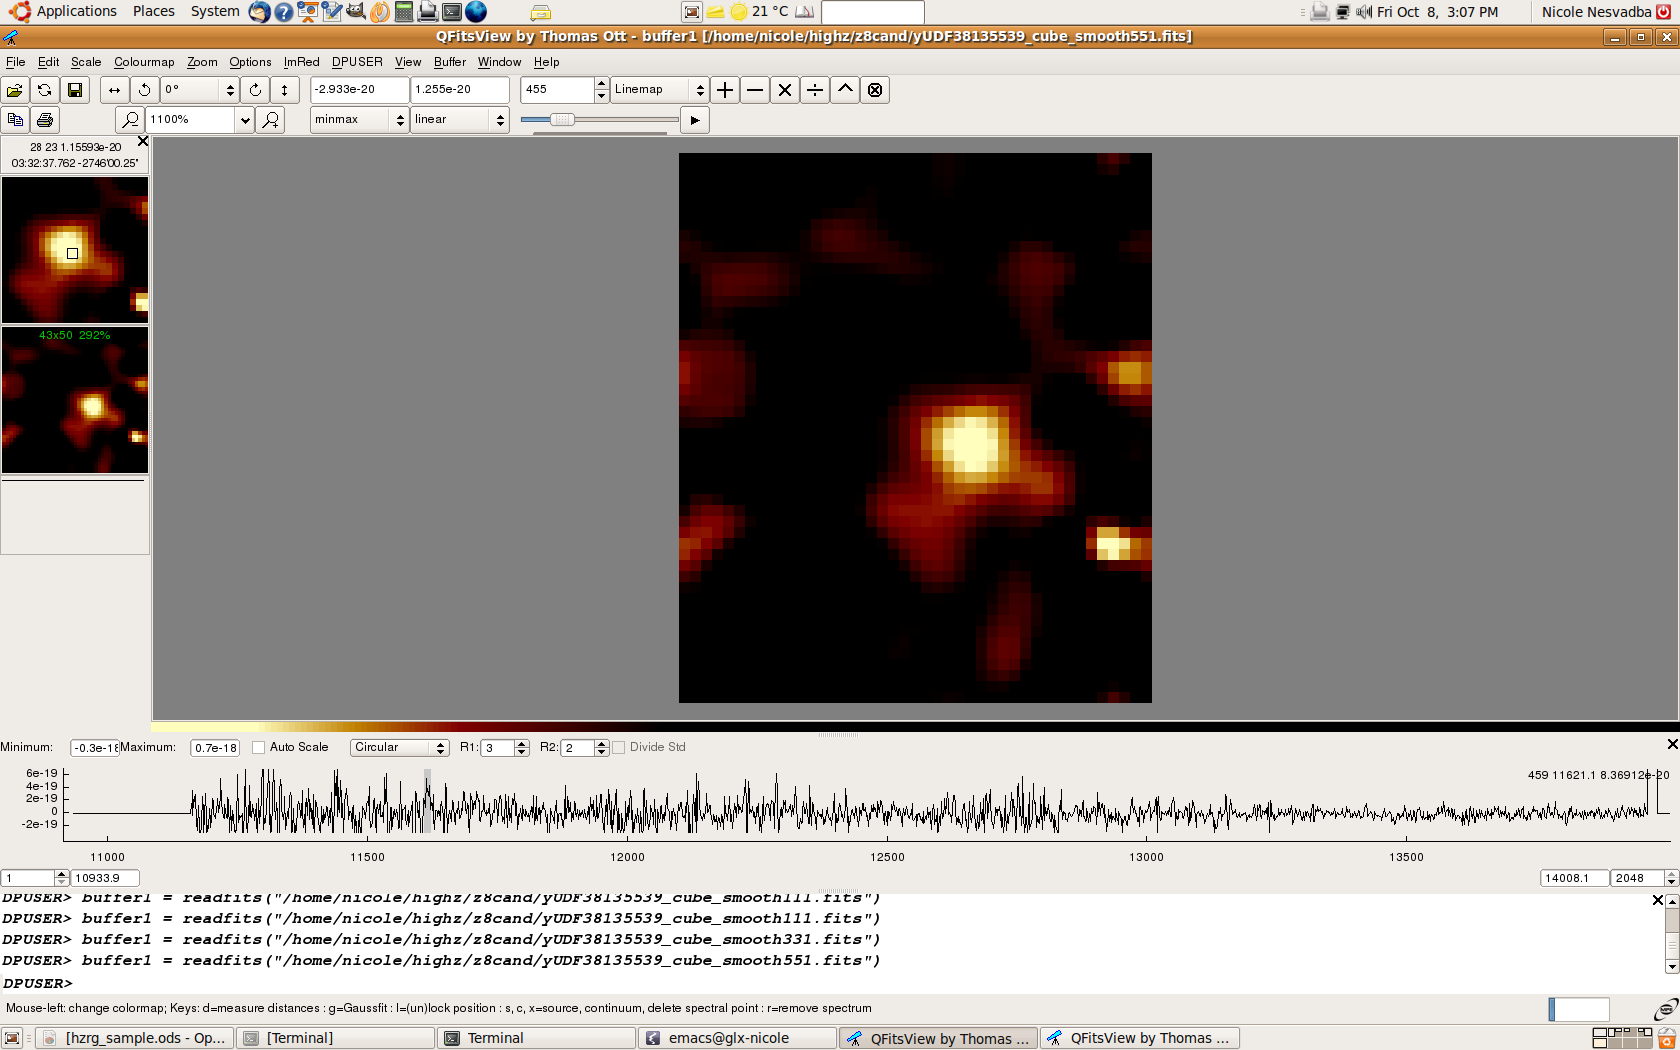
Ly-alpha line image of UDFy-38135539.
In Nature, 467, 940, Lehnert et al. report on the detection of Ly-alpha line emission from a galaxy at z=8.6, UDFy-38135539, which had previously been selected by several colleagues as a high-redshift candidate from HST WFC3 photometry (links to the photometry papers are listed to the right).
Reproducability and transparency are basic principles of science. To allow the community to judge the robustness of our results, we have therefore requested ESO to make our raw data sets public as of now. Please go to the page by following the links on www.eso.org/sci. The program ID is 283.A-5058.
We also provide access to the fully reduced SINFONI data cubes, along with instructions on how to scrutinize imaging spectroscopic data, which is still not standard in the optical/near-IR community.
Please contact the authors prior to submission if you wish to use these data cubes for a publication.
Robustly interpreting imaging spectroscopic data cubes in the near infrared is far from being trivial, in particular when observing very faint targets. We therefore discuss in the following the main sources of noise, resulting peculiarities in these spectra, and the strategy adopted in our analysis to mitigate against these effects.
Noise characteristics in NIR IFU data
It is critical to take into account that the SINFONI noise is non-Gaussian and a strong function of wavelength. The main reason for this is in the spectrum of the Earth's atmosphere in the J-band, which is affected by strong line emission from OH molecules. In the sky-noise limit, the noise is dominated by photons from the night sky, scaling roughly as SQRT(2 x N_photon). The factor 2 comes from the fact that we subtract a sky frame from each source frame to remove the night sky from individual exposures.
Bright telluric lines affect the data in several ways:
- Even in absence of all other effects, and with a (hypothetical) 'perfect' data reduction, the Poissonian noise is strongly enhanced around the wavelengths of night-sky lines. Night-sky lines measured from 'sky cubes', i.e., cubes which were reduced in exactly the same manner as the data, but without subtracting the sky, are up to 100 times brighter than the sky flux at the wavelength of our line detection, resulting in an order of magnitude greater Possonian noise at certain wavelenghts. Clearly, for this reason, we cannot determine the noise simply by averaging over the rms in the spectrum, but have to select wavelength ranges where the sky is not brighter than at the wavelength of the line we study.
- The subtraction of the night sky is not perfect. This is due
to
small wavelength shifts between the source frame and the sky frame,
of order of 1/10 of a spectral pixel (~0.15 A, or 1/60 of the spectral
resolution). This shift is smaller than other uncertainties in the
data,
but since night-sky lines are so bright, their wings are seldom removed
perfectly. This adds additional, non-random noise -- "night-sky-line
residuals" -- which are characterized by their narrowness and
frequently
having a negative flux on the blue side and positive flux on the
redside
or visa verse ("P-Cygni profile" or its inverse). For relatively
faint
night-sky lines, these residuals may be suppressed when combining a
large number of frames, but for brighter lines, or when the wavelength
calibration is not not very accurate, this becomes a significant source
of noise. Cubes with *_nsk_* listed to the right have regions clipped where the night sky is at least 2x brighter than at the wavelengths of the line.
- Another important source of noise are "bad", i.e., "warm"
and "hot" pixels. The Spitzer IRS team and community refers to
such pixels as"rogue". Such misbehaving pixels are a (not unique)
feature of IR detectors, originating from pixels with a time-dependent,
non-linear response. Although the data reduction cleans them to a
certain degree
which depends on the number of exposures, how badly they mis-behave and
several other factors, individual pixels in the final data set may
retain a measurable residual effect of these pixels. These residuals
will leave very narrow features behind in the final spectrum, which are
much brighter than the surrounding pixels only influenced
by noise from the background.
Additional effects include
- "Bad" pixels are particularly prevalent in the periphery of the detector (which are mapped onto certain central regions of the data cubes due to how the SINFONI image slicer works)
- A small region on the detector, where the detector is connected to the readout electronics, is "blind". In the J-band this adds additional noise at wavelengths of about 12100 A - 12200 A.
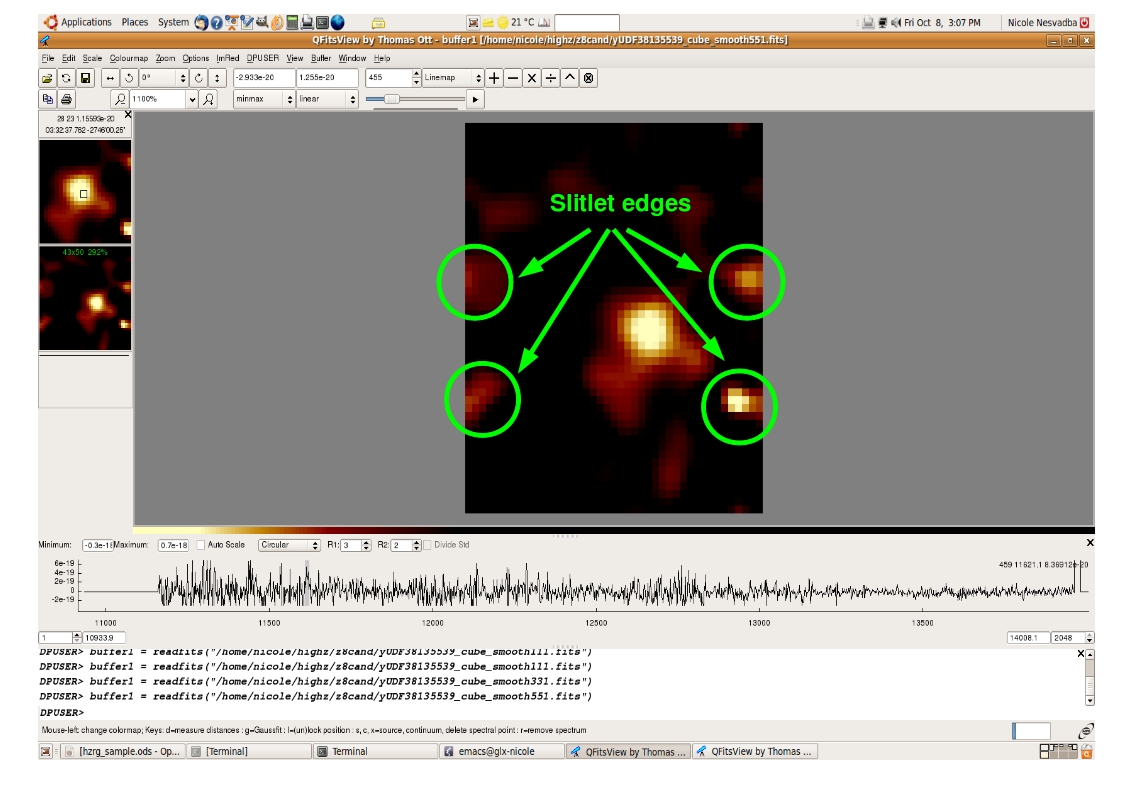
- The wavelength calibration is somewhat less accurate at the edges of slitlets (i.e., image rows), leading to enhanced numbers and stronger night-sky line residuals in these areas.
- Near slitlet edges, bright night sky lines may be scattered
onto adjacent slitlets on the raw detector (not corresponding to
adjacent slitlets in the cube, see the SINFONI manual on the ESO
website). Adjacent slitlets are not at the same wavelength in the raw
frames, so that these residuals do not appear at the nominal wavelength
of a night sky line. Note also that this relates to the edges of
slitlet in individual exposures. Since we used a non-redundant dither
pattern, these are not necessarily at the edge of the combined cube.
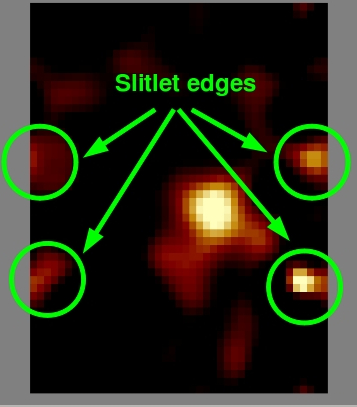
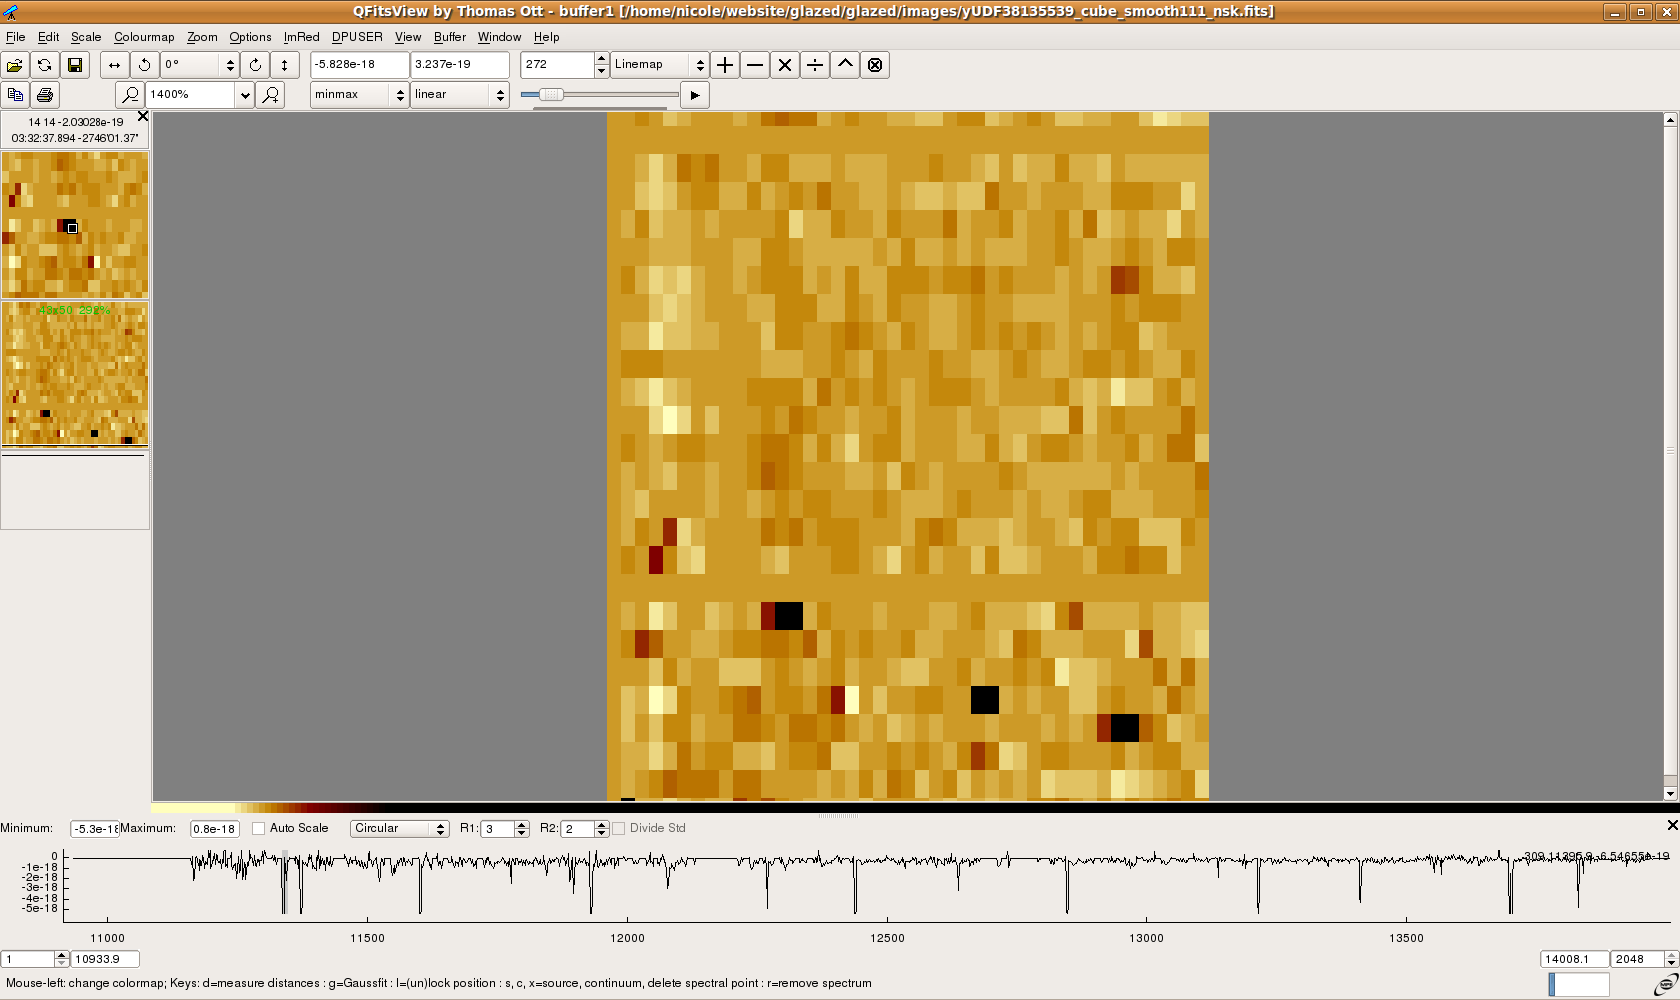
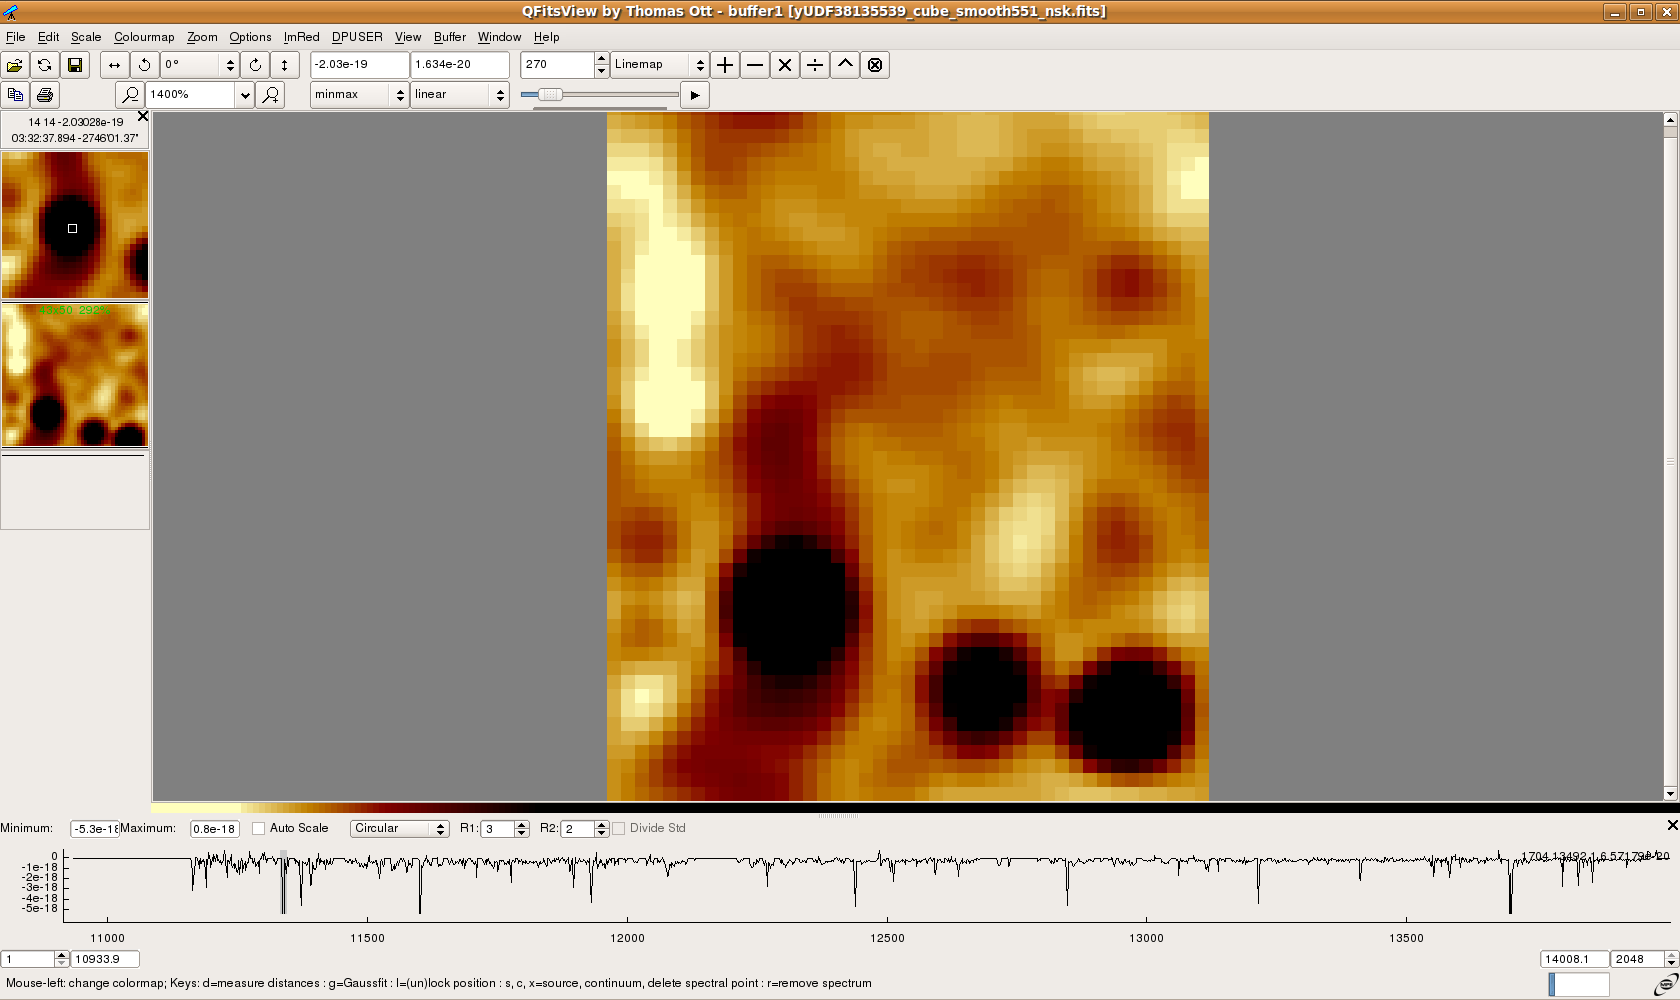
Effects near slitlet edges due to bad night-sky subtraction. A set of examples of QFitsView screenshots is listed to the right.
- At wavelengths below about 1.15 microns, the transparency of
the Earth's atmosphere changes rapidly with wavelength. This may lead
to additional artifacts in the spectrum.
The line does not fall into any of these regions. However, including these regions in the calculation of the noise does matter. Our calculation of the significance of the line is based on a noise estimate extracted from regions in the cube that are similar to that of the data.

Transmission of the Earth's atmosphere in the blue part of the spectrum.
Identifying noise features
The above should have made it it clear that scrutinizing the reality of an astrophysical emission line from SINFONI data cubes requires some care and expertise. A main advantage of SINFONI is that is oversamples the emission line of an astrophysical object both spectrally and spatially.
The following checklist may be of help when interpreting our data cubes:
- At what wavelengths do
you estimate the rms? Do not estimate the rms of a
spectrum at wavelengths where the sky is brighter than near the line.
Ideally, estimate the rms from the spectrum near the source, after
carefully verifying that no bad pixels are present. Note that, since
the line of UDFy-38135539 is spectrally and spatially resolved (see
below), and therefore spread over 150 pixels in the cube, the
signal-to-noise is that of the integrated line. It cannot be derived
from the SNR of the line core in an individual pixel.
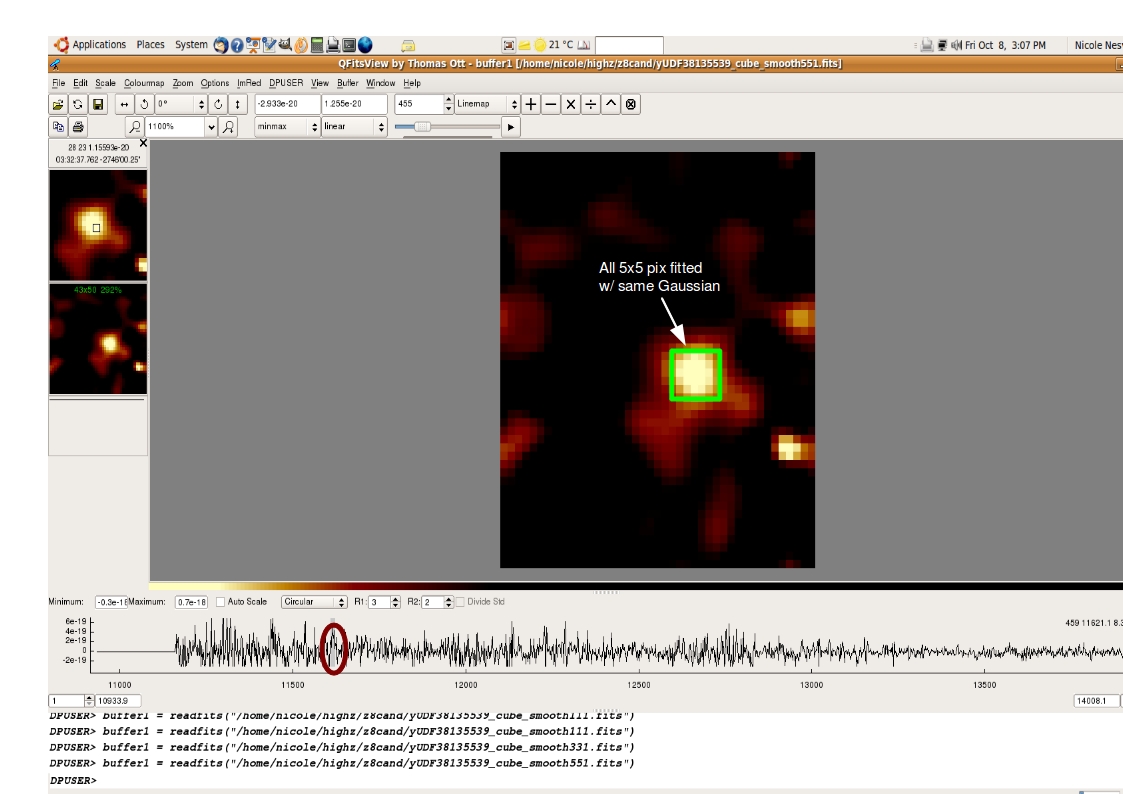
- Is the source spatially resolved? Our data are seeing-limited. This means, any astrophysical object is oversampled spatially. The point spread function as measured from standard stars (see the supplementary material to our paper) is 0.6"x0.7", compared to a pixel scale of 0.125"x0.25" along the detector's x and y-axis, respectively. (The different sizes result from the design of the image slicer; for practical reasons, in the fits data cube pixels are 0.125"x0.125"). Any astrophysical source that has been unavoidably blurred by the seeing, is therefore smeared over at least 5x5 pixels in the spatial image. This is the basic idea of the "multiplicity test" described in the paper. With this test we did not identify any spatially resolved feature similar to the line from UDFy-38135539. Note that the flux in different slitlets of the source has been mapped on very different regions on the SINFONI detector, and originates from very different, non-adjacent regions in each raw frame. This minimizes cross-talk and aliasing.
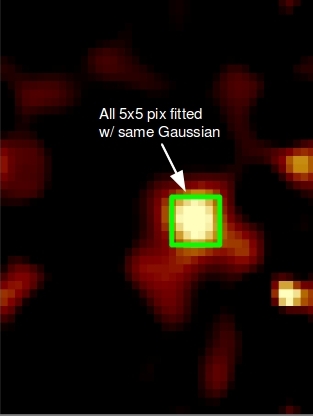
The 'multiplicity test' described on the paper is based on the fact that for the source, we were able to fit all pixels in a 5x5 pix spatial region with Gaussians at the same redshift and with the same line width. This was not possible for any other part of the data cube with equally low noise in 25,000 randomly picked pixels.
- What is the sampling of
the line in spectral direction? The spectral resolution in the
J-band as measured from (spectrally unresolved) night sky lines
corresponds to a full-width at half maximum of FWHM ~ 4 spectral
pixels.
4 pixels is the minimal FWHM for any emission line of astrophysical origin. A feature more narrow that this is due to noise, most likely a night-sky line residual. The measured line of UDFy-38135538 has FWHM~6 pixels and a profile which is well fitted with a Gaussian profile, as expected for a line with a width that is near the spectral resolution of the instrument. Note that because of this effect, a noise feature may become indistinguishable from an astrophysical signal when smoothing the cube in spectral direction.
These data were not reduced with the standard ESO pipeline, but with a custom set of routines, which are optimized to observe faint emission lines from high-redshift galaxies. These routines are very well tested on SINFONI data cubes of more than 100 high-redshift galaxies, and have been used to reduce the data presented, e.g., in Lehnert et al. (2009), ApJ 699, 1660, and all publications of SINFONI data led by Nesvadba. Comparison with other SINFONI data reduction packages
suggest they produce results that are more robust for very faint objects.
Please contact the authors for any additional information you may require. In particular, we would be very grateful for comments on the presentation of the website, questions about the interpretation of the data and its significance, and anything else that you might find unclear about the presentation, data, or our results.
Reference
Lehnert, M. D., et al.: Spectroscopic
confirmation
of
a
galaxy
at
redshift
z=8.6 Nature, 467, 940